 donald
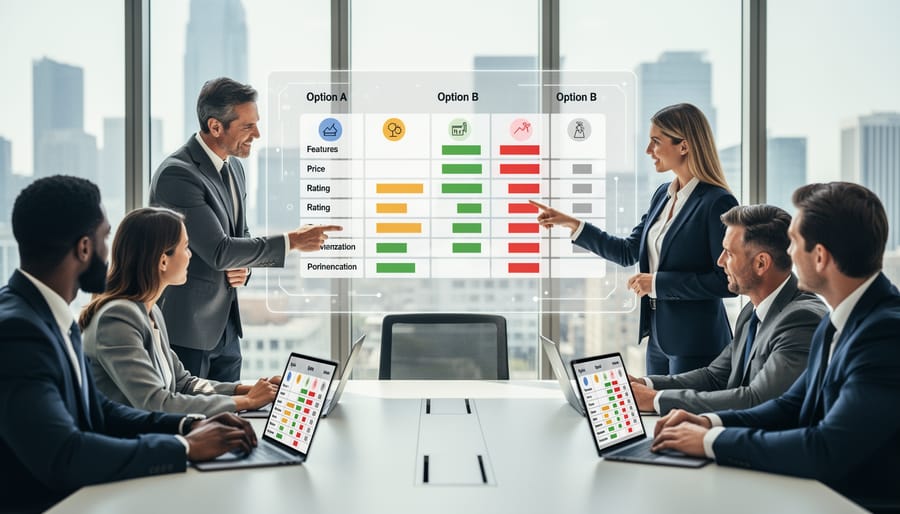
A comparison chart is a visual tool that displays multiple options side by side, highlighting key features, specifications, and differences to help you make faster, more informed decisions. Rather than forcing you to flip between product pages or sales sheets, a well-designed comparison chart organizes critical information into columns and rows, making it easy to scan attributes, weigh trade-offs, and identify the best match for your needs.
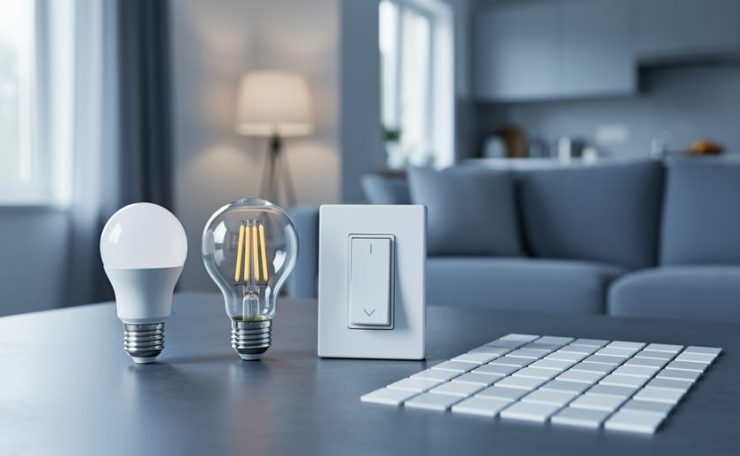
For anyone choosing lighting fixtures, comparing LED bulbs, or evaluating smart dimmer switches, comparison charts eliminate guesswork. You can instantly see how color temperature, lumen output, wattage, and price stack up across several products without hunting through technical datasheets. This structured approach saves time and reduces the risk of overlooking important details that impact performance, energy efficiency, and long-term cost.
This article explains what comparison charts are, how they work, the different types you’ll encounter, and where they prove most valuable. Whether you’re a homeowner upgrading your kitchen lighting or a designer specifying fixtures for a commercial project, understanding how to read and use these charts will sharpen your decision-making and ensure you choose solutions that truly fit your requirements.
What Is a Comparison Chart?
A comparison chart is a visual tool that organizes information about multiple products, services, or options into a structured format, typically using rows and columns to display features, specifications, and characteristics side-by-side. This layout allows you to scan across alternatives quickly and evaluate differences at a glance, rather than reading through separate product descriptions and attempting to keep track of details in your head.
The fundamental purpose of a comparison chart is to simplify complex purchasing decisions by presenting relevant information in parallel. When you’re choosing between pendant lights for your kitchen or selecting downlights for a commercial project, a comparison chart eliminates the mental burden of flipping between product pages or specification sheets. You see all the critical details, lumens, color temperature, dimming compatibility, dimensions, and price, aligned for direct evaluation.
- Comparison Chart
- A structured visual display that presents multiple options side-by-side, organizing features and specifications in a format designed for quick evaluation and decision-making.
- Product Matrix
- A grid-style comparison tool that maps products against specific criteria, allowing systematic evaluation of how each option performs across defined attributes.
- Feature Comparison
- The practice of evaluating products by examining specific characteristics or capabilities they offer, highlighting differences and similarities that matter to the purchasing decision.
- Side-by-Side Analysis
- A comparison method that places options adjacent to one another, enabling direct visual scanning and contrast of key attributes without shifting focus between separate sources.
This structured approach transforms what could be an overwhelming selection process into a manageable task. Instead of remembering whether the chandelier you looked at ten minutes ago had adjustable height or required hardwiring, the chart places that information directly beside the competing option. For lighting professionals working with clients, comparison charts serve as decision-support tools that bring clarity to consultations and help justify recommendations with transparent, objective data.
How Comparison Charts Work
The Visual Structure
A comparison chart’s power lies in its grid-based layout. Most charts position products as vertical columns across the top, with features or specifications listed as horizontal rows down the left side. This creates a matrix where each cell contains a specific data point, for example, a lighting fixture’s lumen output or color temperature at the intersection of that product column and feature row.
Some charts reverse this arrangement, placing products as rows and features as columns, particularly when comparing fewer items with many attributes. The choice depends on the number of products and features being evaluated.
This structured format lets your eyes scan vertically to compare how different products perform on a single criterion, say, comparing the dimming capabilities of five pendant lights at once. Alternatively, scanning horizontally reveals all specifications for one product in sequence. The grid eliminates the need to flip between separate product pages or hold multiple details in your memory.
Visual alignment matters too. Consistent spacing, clear headers, and uniform cell sizes prevent confusion and reduce cognitive load. When specifications align precisely in their respective cells, differences become immediately apparent, you spot the fixture with higher lumens or lower wattage without rereading paragraphs of text.
Data Organization Principles
Effective comparison charts rely on three core organizational principles that transform raw data into actionable insights.
Information prioritization determines what appears at the top of the chart. The most decision-critical attributes, such as lumens, color temperature, or price for lighting fixtures, occupy prime positions where users look first. Secondary details like warranty periods or certifications appear lower in the hierarchy. This ranking reflects actual purchasing priorities rather than arbitrary arrangement.
Consistent measurement units eliminate confusion and enable direct comparison. A chart listing one fixture’s output in lumens and another’s in watts creates false equivalencies. Quality charts standardize every metric: all dimensions in inches, all brightness in lumens, all color temperatures in Kelvin. This consistency extends to formatting, currency symbols, decimal places, and abbreviations remain uniform across all columns.
Strategic highlighting draws attention to meaningful differences. Visual cues like color coding, checkmarks, or bold text emphasize where products diverge significantly. For instance, if one pendant light offers ten dimming levels while competitors offer three, that distinction deserves visual prominence. Conversely, identical specifications across all options can appear in neutral formatting, allowing users to focus mental energy on the variables that actually matter to their decision.
Types of Comparison Charts
Feature-Based Comparison Charts
Feature-based comparison charts organize products by their functional capabilities rather than pure specifications. These charts typically list key attributes that directly impact user experience and performance, particularly valuable when evaluating lighting solutions where multiple functional considerations influence the final choice.
For lighting fixtures, a feature-based chart might compare dimming compatibility, smart home integration, installation method, and aesthetic finish options across several models. This format helps identify which products offer the essential capabilities you need. When reviewing comprehensive resources with light fixtures compared side-by-side, you can quickly spot which options include features like adjustable color temperature or compatibility with existing dimmer switches.
Design professionals favor these charts because they align product capabilities with project requirements without getting lost in technical minutiae. A homeowner might use a feature-based chart to confirm that a pendant light offers both dimmability and the right mounting hardware, while a designer ensures a fixture provides the beam angle control needed for accent lighting applications.
Specification Comparison Charts
Specification comparison charts dive into the technical details that determine whether a lighting fixture will actually work in a given space. These charts display precise measurements, wattage, voltage requirements, dimensions, beam angles, IP ratings, and compatibility with existing electrical systems. For architects and designers, this level of detail prevents costly mistakes during installation.
A well-constructed specification chart groups technical data by category: electrical requirements in one section, physical dimensions in another, and performance specifications separately. This organization lets professionals quickly verify code compliance, confirm fixture compatibility with junction boxes, and ensure the product meets project requirements. When specifying lighting for commercial buildings or renovation projects, these charts become indispensable reference documents that eliminate guesswork and reduce the risk of ordering incompatible products.
Price and Value Comparison Charts
Price and value comparison charts integrate cost information with product features to reveal the true value proposition of each option. Unlike simple price lists, these charts position price alongside key specifications, lumens per dollar, energy cost over lifespan, or warranty coverage, so buyers can assess whether a higher upfront cost delivers better long-term value. For lighting projects, this format helps clients see when premium fixtures justify their price through superior efficiency, durability, or performance.
These charts typically organize products from lowest to highest price while displaying corresponding feature sets, allowing immediate identification of the best value within budget constraints. Budget-conscious homeowners can spot where diminishing returns begin, while design professionals can demonstrate to clients why mid-range or premium fixtures may offer better ROI through reduced energy bills or maintenance costs over five to ten years.
Visual Comparison Charts
Visual comparison charts prioritize imagery over specifications, displaying products side-by-side so you can evaluate aesthetic differences at a glance. Rather than reading descriptions of finishes, shapes, or styles, you see actual product photos arranged in a grid that lets you compare design elements directly.
For lighting fixtures, this format proves invaluable when choosing between similar styles, pendant lights with varying shade shapes, chandeliers in different finishes, or wall sconces with distinct decorative details. A visual chart might show six bronze pendants side-by-side, revealing subtle differences in proportions, texture, and design language that specifications alone cannot convey.
These charts work particularly well during client presentations, allowing designers to showcase options while clients immediately identify their aesthetic preferences. The visual format eliminates ambiguity about appearance and helps match fixtures to existing décor without relying on written descriptions that can be interpreted differently.
Common Uses for Product Comparison Charts
For Homeowners and DIY Projects
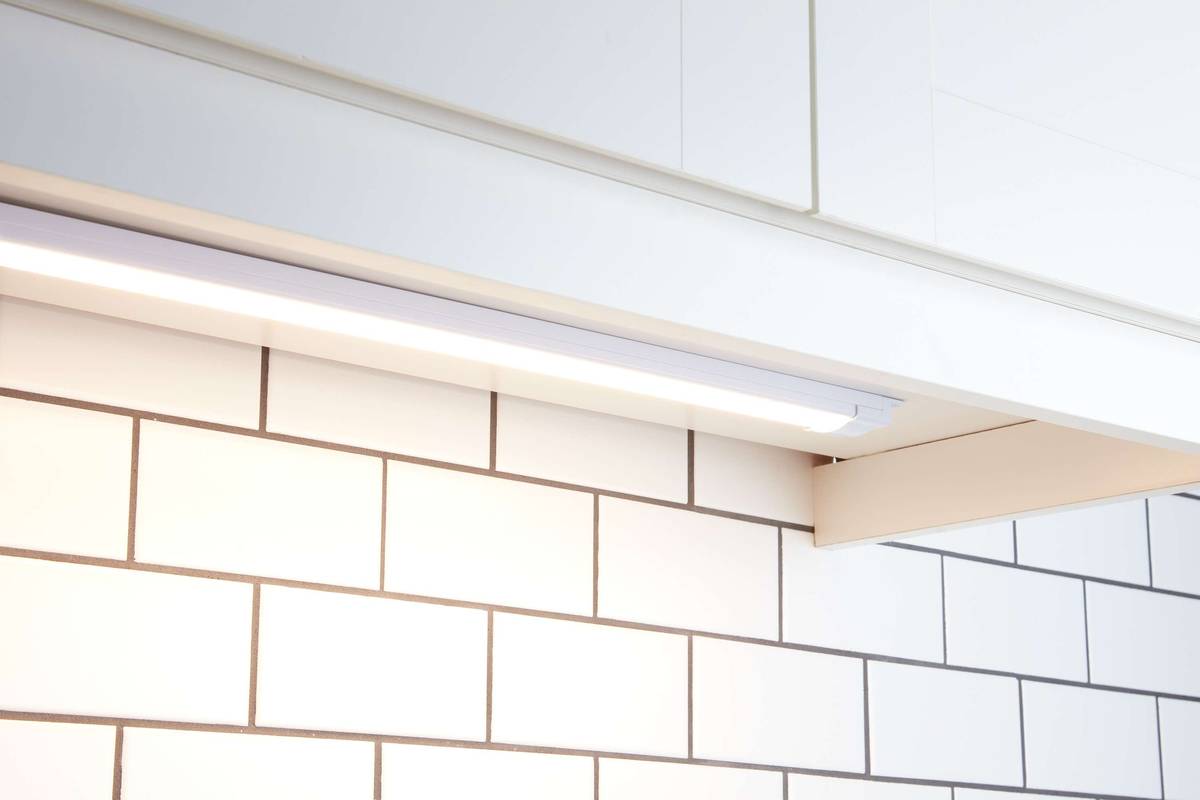
For homeowners tackling lighting projects without professional help, comparison charts eliminate guesswork by presenting technical specifications in plain terms. Instead of reading lengthy product descriptions to understand differences between fixtures, a chart instantly reveals which LED bulb delivers the right brightness for a reading nook or which under cabinet lighting system fits your kitchen layout. Charts translate industry jargon, lumens, color temperature, CRI, into side-by-side values you can actually compare, letting you match products to your specific needs without calling an electrician. This visual format builds confidence in your selections by showing exactly what you’re getting for your money, which features matter for your space, and how products stack up against each other on the criteria that affect daily use.
For Design Professionals
Design professionals rely on comparison charts to streamline the specification process and communicate complex lighting decisions to clients efficiently. During the design phase, architects and interior designers use these charts to evaluate multiple fixture options against project requirements, matching lumen output to space calculations, coordinating color temperatures across zones, and ensuring dimensional compatibility with ceiling or wall installations.
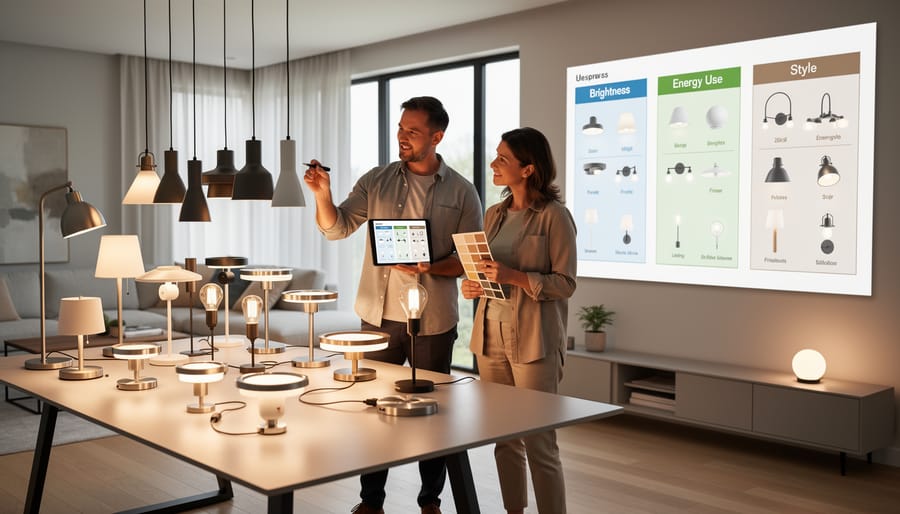
When presenting to clients, comparison charts transform technical specifications into clear visual narratives. Rather than explaining each product’s features separately, designers can display three to five viable options side-by-side, highlighting how each meets the project’s aesthetic vision while noting trade-offs in cost, performance, or installation complexity. This approach gives clients ownership over decisions while keeping selections aligned with design intent.
In specification documents, comparison charts serve as reference tools during procurement and installation. They document the rationale behind fixture selections, provide contractors with quick-reference specifications, and create a paper trail for future maintenance or replacement needs.
For Commercial Buyers
Commercial buyers face distinct challenges when specifying lighting for multi-unit developments, office complexes, retail chains, or hospitality properties. Comparison charts become strategic procurement tools in these scenarios, enabling purchasing managers to evaluate hundreds of fixtures across vendors while maintaining budget discipline and project timelines.
For large-scale installations, charts help compare warranty terms, lead times, bulk pricing tiers, and long-term maintenance costs, factors that dwarf initial purchase price in total cost of ownership. A facilities manager upgrading warehouse lighting can use specification charts to match fixture output, mounting heights, and energy consumption against operational requirements, then filter by vendors who meet delivery schedules and volume discounts.
Comparison charts also facilitate stakeholder alignment. When presenting options to finance teams, procurement committees, or property owners, a well-structured chart translates technical specifications into business value, showing how the LED lighting revolution delivers measurable ROI through reduced energy costs and maintenance intervals. This visual evidence supports business cases and accelerates approval processes for capital expenditures.
Key Benefits of Using Comparison Charts
Comparison charts transform the often-overwhelming task of product selection into a manageable, methodical process. The most immediate benefit is time savings, rather than clicking through dozens of individual product pages or juggling multiple browser tabs, you can evaluate six or eight lighting fixtures in seconds. This efficiency matters even more when you’re comparing technical specifications like lumens, color rendering index, and beam angles across multiple options.
Beyond speed, comparison charts provide an objective framework that removes emotional guesswork from purchasing decisions. When you see specifications side-by-side, the differences become quantifiable rather than subjective. A pendant light that seemed perfect in isolation might reveal limitations when placed next to alternatives with superior dimming capabilities or more suitable dimensions for your space. This structured comparison helps you avoid common pitfalls like choosing a fixture based solely on appearance, only to discover it doesn’t provide adequate illumination.
The transparency of comparison charts also builds confidence in your final selection. You’re not relying on marketing copy or trying to remember details from five different product descriptions. Instead, you have clear evidence for why one option suits your needs better than another. For professionals working with lighting design software comparison charts integrate seamlessly into client presentations, providing visual proof points that justify recommendations and align expectations with budget realities.
Frequently Asked Questions
What information should be included in a comparison chart?
Include the features and specifications most relevant to your decision. For lighting, this typically means lumens, color temperature, wattage, dimming capabilities, dimensions, and price, whatever factors matter most for your specific project.
How many products should you compare at once?
Three to five products work best. Fewer than three doesn’t give enough context, while more than five becomes overwhelming and defeats the purpose of simplified comparison.
Are comparison charts better than product reviews?
They serve different purposes. Reviews provide in-depth experience and context, while charts offer quick side-by-side evaluation of specifications. Use charts to narrow your options, then read reviews of your top choices for deeper insight.
How do you know if a comparison chart is accurate?
Check that the data comes from manufacturer specifications or verified sources. Reputable vendors and manufacturers provide accurate charts based on standardized testing, look for consistency in units of measurement and clear sourcing of technical claims.
These questions come up repeatedly when people first encounter comparison charts for specialty products like UVC LED sterilizers or architectural lighting. The format works across categories, but the specific criteria you compare will shift based on what matters in that product category. Trust comparison charts most when they’re created by vendors with technical expertise in their field, as they understand which specifications actually impact performance and user satisfaction.
how it works
A comparison chart works by organizing product information into a grid structure that puts multiple options in direct visual contact. Each column typically represents one product, while each row displays a specific attribute, wattage, color temperature, price, or warranty terms. This layout lets your eye scan horizontally across products for a single feature, or vertically down one column to evaluate a complete offering.
The chart’s power comes from standardization. When data sits in aligned cells using consistent units and formats, differences jump out immediately. A fixture outputting 3000 lumens stands apart from one producing 1500 lumens when both numbers occupy the same row position. You spot gaps in capabilities, identify overlaps in features, and recognize which products cluster together versus which stand alone.
Most comparison charts employ visual cues, checkmarks for included features, dashes for missing ones, color coding for performance tiers. These shortcuts reduce reading time and cognitive load. Rather than parsing paragraphs of product descriptions searching for specific details, you absorb key differences in seconds, making the decision process faster and more objective.
Types or components
Every functional comparison chart relies on four essential components working together. The product column lists each item being evaluated, typically arranged vertically down the left side or horizontally across the top. This establishes what you’re comparing at a glance.
The criteria rows define the features or specifications being measured, lumens, color temperature, dimensions, price, or design style for lighting fixtures. These criteria should address the factors most relevant to your decision.
Data cells contain the actual information for each product-criterion intersection. Effective charts present this data consistently, using identical units and formats throughout. When comparing wattage, every cell shows watts; when comparing dimensions, all measurements use the same scale.
The visual hierarchy guides your eye to meaningful differences through formatting choices, color coding, checkmarks versus X marks, bold text for standout features, or shading to highlight recommended options. This component transforms raw data into actionable insights.
Together, these elements create a decision-making tool that’s both comprehensive and scannable, allowing you to process complex product information efficiently.